Part 2

There are many page speed testing tools but GTMETRIX is one of the best speed tools for speed benchmarking.
- It’s fast
- It’s very reliable
- 100% free (for 98% of things)
- Has a lot of extra tools in the kit
- Has a great scan history
- Easy to read
- Intuitive to learn and use
- Uses Google Core Web Vitals
- Superb ability to compare up to 4 different site speed scans
- All-round brilliant!
- Nope we’re not an affiliate – they don’t have a program!

Join our site speed
training course today
Test WordPress page load speed with 5 more great Gtmetrix tips and tricks
If you are participating in one of our courses use the 5 tips below as your module project exercise.
Perform each one in sequence
[ getus.at/sstwo ]
Content
- READ PART 1 – tips 1 to 5
- GTMETRIX Tip #6 – Gtmetrix Waterfall Report
- GTMETRIX Tip #7 – Find the biggest resources fast
- GTMETRIX Tip #8 – Using the Gtmetrix Video tool
- GTMETRIX Tip #9 – Collaborate on Gtmetrix History report
- GTMETRIX Tip #10 – Gtmetrix speed tips
- Join our site speed online training course for free
Gtmetrix Usage Tip #6
> Review the page assets/requests loaded in Gtmetrix Waterfall report
A webpage is made up of multiple files which are called assets, resources, or in Gtmetrix case requests – because the assets are being requested from the source server.
While the user of a website may think a website is just a single element, it is in fact comprised of multiple elements.
These elements are combinations mainly of :
- Images
- JS script (javascript code) – used to create page functionality
- CSS (cascading dtyle sheets) – used to format the page
- Fonts – used to display the text on the page
- HTML code (HyperText Markup Language) – used to put all the pieces together so the browser can display the page
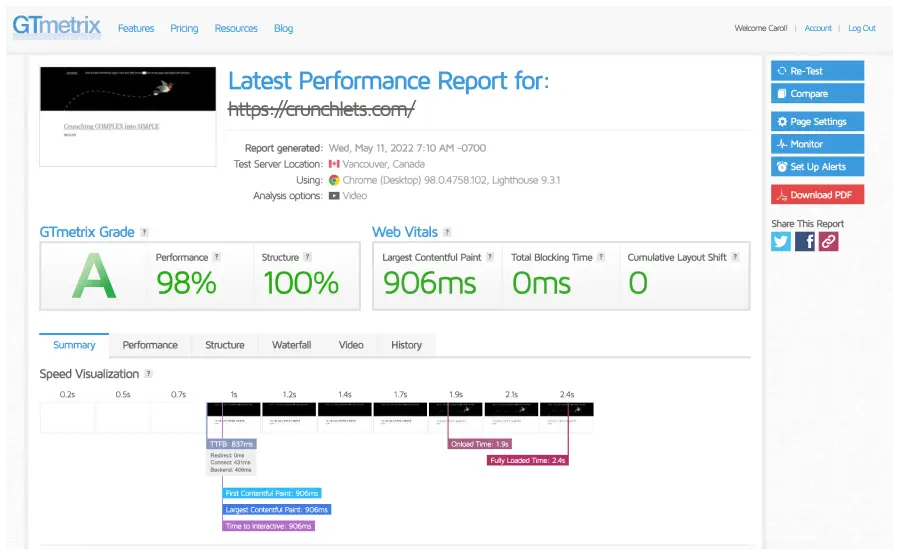
Gtmetrix Waterfall Report
The Gtmetrix report has many tabs – one of these is the Waterfall Tab.
To access this just add : #waterfall to the end of the report URL like this:
https://gtmetrix.com/reports/crunchlets.com/eKQuIYie/#waterfall
Go ahead – run a report right now for your website and then add #waterfall to the URL and open it in a new browser tab or window and you will see this:
To access the other tabs directly (perfect for sending to someone) use the following anchor text :
- Summary ~ #summary
- Performance ~ #performance
- Structure ~ #structure
- Video ~ #video
- History ~ #history
Easy!
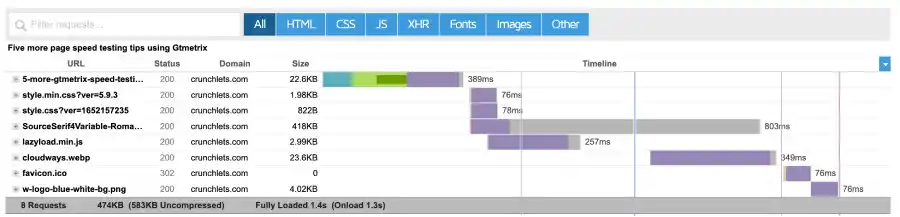
Right now – on one of your reports go to the waterfall tab and hold and hover your mouse over one of the horizontal bars on the right.
These horizontal bars indicate the load time and are colour-coded.
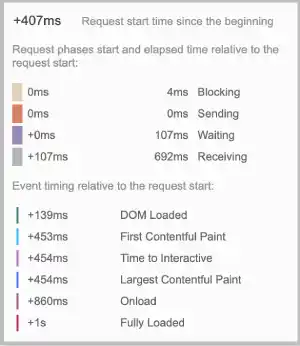
The pop-up overlay screen will look similar to the image on the right. And as you can see on this image the number of milliseconds are displayed for things like: waiting, receiving, sending and blocking.
Depending on what the request is and where it is being loaded from you may see some other items.
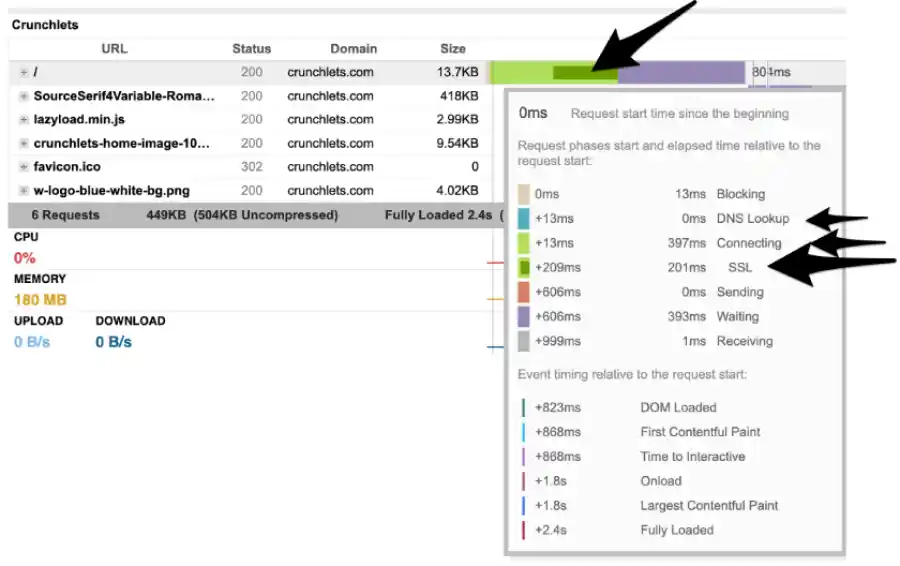
As you can see below the item highlighted is being loaded in a slightly different way. If you look closely you can see the DNS lookup and SSL time.
These were not shown on the other key above because the request was not the FIRST request from the server. When a request is loaded from a NEW server there is a DNS lookup and SSL processing time as show below.
Run a gtmetric report right now for this URL :
And try to count the number of DNS lookups — here is a tip each different domain will need a DNS lookup and SSL processing. I counted over THIRTY!
As you can see EACH DNS/SSL processing takes around 230ms – so a 1/4 of a second. So you do the math –
- How many seconds does the NY times page take to load JUST DNS/SSL ?
Now you can probably see the importance of reducing the number of3rd party sites used to retrieve information.
It is always best to load content from your own server whenever you can.
Gtmetrix Waterfall Data
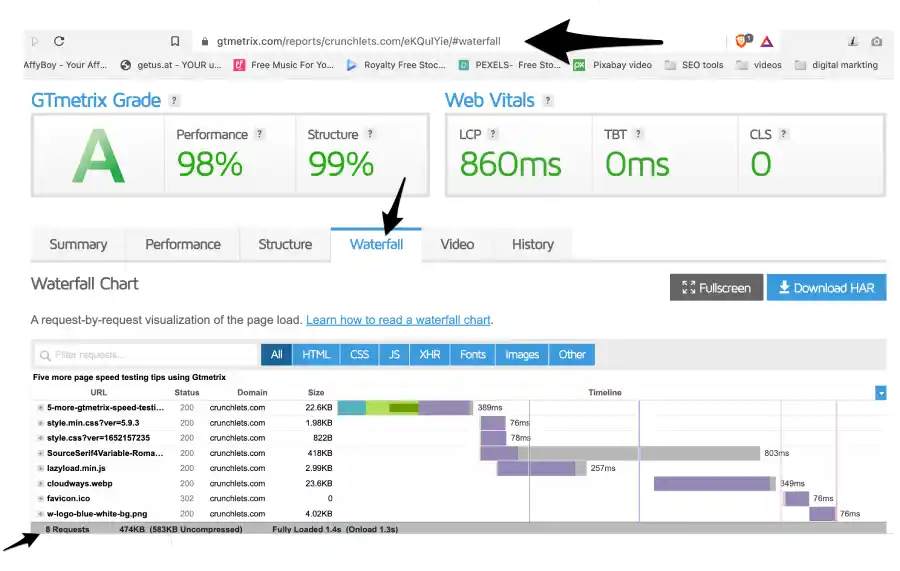
Take the time now to analyse the Gtmetrix waterfall report – there is SO much information displayed in such an elegant and simple way.
For example – take note of the filtering and sorting functionality built into this report.
Gtmetrix Usage Tip #7
> Find the biggest resources in a few seconds
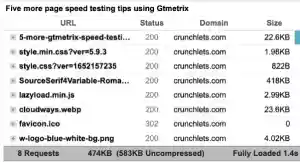
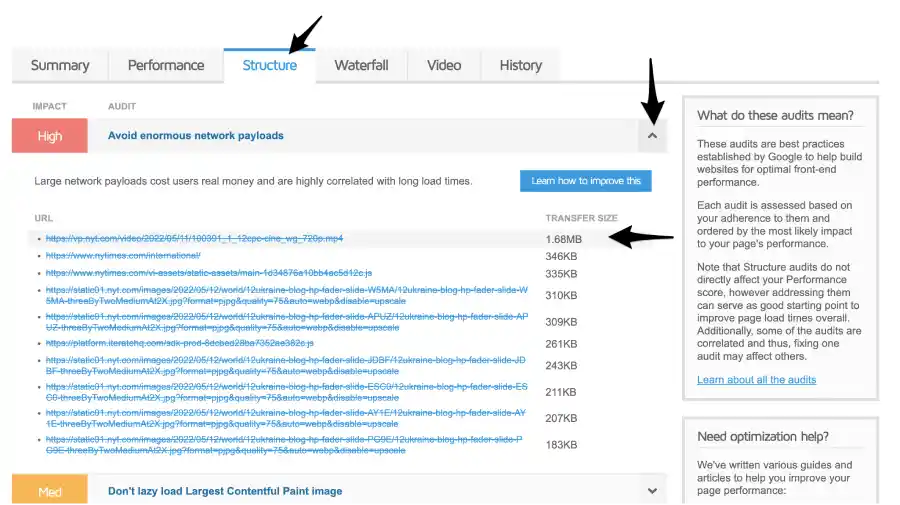
If a web page is weighed down by big resources you can get a list of these resources or requests very fast using Gtmetrix.
Find the biggest images
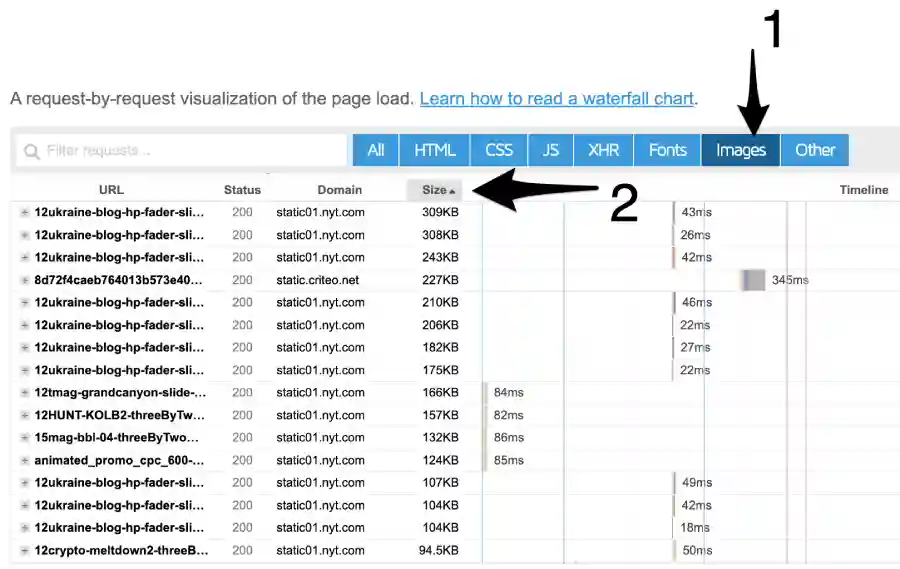
- Go to the Waterfall tab on your Gtmetrix report
- Click on the Images filter button (step 1 in image above)
- Click on the Size column header (step 2 in image above)
You will now see the images sorted into size order.
Click the Size column header again to reverse sort to find the smallest images.
As you can see in the image above (from NY Times website) there are many oversized images – around 30!
So even professional websites do not have the best web publishing practices!
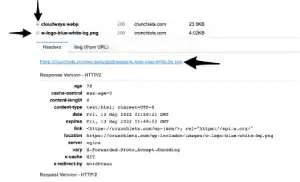
To create a list of the images you can copy the text with your mouse onto the clipboard and paste into a text document.
Right now open a report for your website and find the largest file being loaded on the whole page. Click on the small + image next to the file and pick up the full file and path name.
Not all images are displayed on Gtmetrix
There is something called LAZY LOADING which is a website / server technique to only load content when the user scrolls down a page.
Lazy loading is often used for images so that the browser does not have to fetch all the images at once when a page is requested. Instead as the user scrolls the images are loaded.
When looking at a Gtmetrix speed report it will not show the images that are lazy-loaded.
It is possible to have some very big images downloaded but you do not get to know about them using Gtmetrix.
To view all the images being loaded you will need to use another tool such as Developer Tools (a tool that comes with your browser).
Read this article by the WP-ROCKET team to learn how to check for lazy loading images:
WP-ROCKET offers a great WordPress speed tool that every WordPress site should use. We use it on all our sites.
Gtmetrix Usage Tip #8
> Find speed issues using the video tool
Often it helps to observe visually how a page loads.
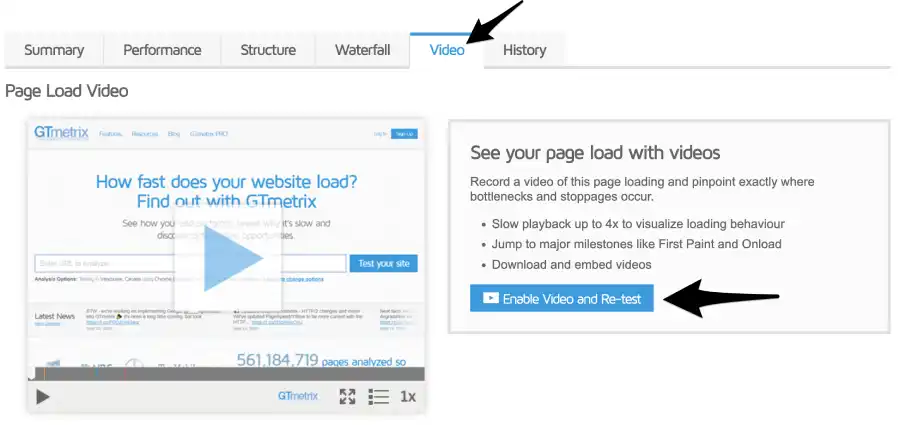
Gtmetrix has a free tool (register and sign in for free first) where you can take a video of the page loading.
Right now go and do this:
- Login to Gtmetrix (join if you don’t have a FREE account)
- Open up an old report or run a new scan on your website
- Click on the Video tab
- Click the Enable Video and Re-test button on the right (shown in the image above)
The Gtmetrix video tool is very good to help you resolve Largest Contentful Paint issues (part of Google Core Web Vitals).
The video can also be super helpful to show you content layout shift issues – or Cumulative Layout Shift (CLS) – another key Core Web Vitals metric.
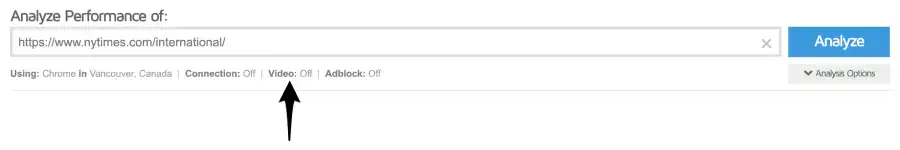
Right now go and test this page and add a video:
- Go to Gtmetix sign in
- Run a scan for this page : https://www.nytimes.com/international/
- Click on the Video doggle option button under the URL field – see image below
- Doggle the Video ON
- Click Analyse button
- Go to the Video tab of the report once the report has finished
- IF the report will not run (the page is VERY SLOW to load) re-run the Gtmetrix scan !
- See if you can see which image loads SECOND (it should be an advert)
Give Cloudways a SPIN – no credit card needed – 3-day FULL trial …
Cloudways gives you an EASY admin for a SUPERFAST VPS – so easy to use – no tech skill needed — with ALL THE POWER – at AMAZING PRICES (easy migration tool available)
Gtmetrix Usage Tip #9
> Collaborate on your Gtmetrix history report
A little known tool on the Gtmetrix Histrory report is the Add Note tool.
If you add a note to a report (you have to be logged in) the note is saved as part of the report.
If you then share the report URL with someone else – remember you can share the History tab by adding #history to the end of the URL – they will see the notes you add.
You can add a note to any point on the History report.
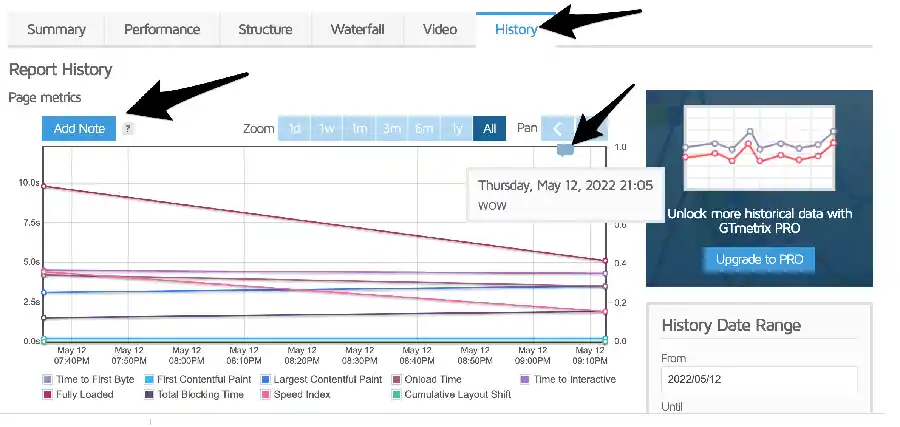
Try this out for your self now:
- Login to Gtmetrix
- Open an existing report
- If you have only run the report once – run it again (so there is a bigger history)
- Click the Add Note button as shown in the image above
- Move your mouse to where you want to add the note and click your mouse
- Add your note and click Save
- Add a note to any part of the report – see the note icon on the image above
Gtmetrix Usage Tip #10
> Let Gtmetrix help you speed up your site
OK, we know – you want an easy life!
Gtmetrix makes your life easy by giving you a prioritised list of detailed tasks.
This list is super helpful when you first start website speed optimization work.
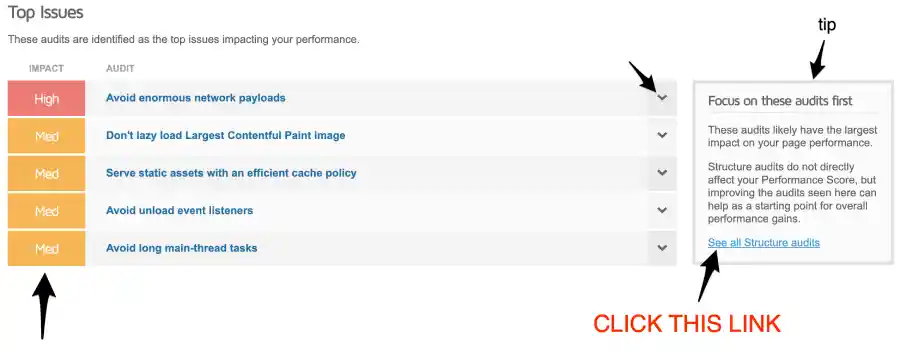
Go look at the issues on your site right now:
- Login to Gtmetrix
- Open an existing report or run a new report
- Click on the Structure tab
- Scroll down to the High priority item (if there is one)
- Click the Drop down menu against the item

- Review the list of speed recommendations Gtmetrix shares
That’s all folks for now!
Do try out all the exercises above – practice makes perfect!
The more you use Gtmetrix and all its amazing tools then the faster you will be able to make your website.
And do give Cloudways a spin – we use this on all our sites. And have used their services for the last three years – hence why we recommend them.
If you want fast site speed your server has to be fast also!
In fact, your server is THE most important part of your website!
It’s the HEART of your site – so should be RED HOT!
Give Cloudways a free spin now – full disclaimer – we are an affiliate for them — but we love how they make our life easy while giving us a RED HOT site for a super price.
We can do it for you for free
If you would like to test Cloudways out on your live site we can help you – fill in this form here – and we will create a FULL account for you to play with for 3 days – zero cost to you (we just need some super basic details from you) – and we can migrate your current site across as well if you like so you can see how your site performs.
Thank you for being with us today.
Catch you again SUPER SOON.
Join our online site speed
training course today ~ check out some of the free preview video modules
This page contains affiliate links. They do not cost you anything and we receive a small commission if you decide to purchase the services promoted. This helps us finance great free content like this page and many of our courses and online videos.